On the back of positive global cues Nifty Future opened gap up. As there was a double bottom on expiry day at strong support of 5648. There was an expectation that Nifty Spot would end the consolidation and break out of the 5720 top. The gap up open lead to a spike and channel trend and Nifty Spot managed to break out above the 5720 level but encountered heavy selling at 5730. The 5730 level was the channel high of the trend channel line drawn from 5348 swing high to the previous 5720 top. The price started to form a bull flag or wedge which transformed into a tight trading range with bottom at the Nifty Spot level of 5720. The breakout failures at corresponding Nifty Spot level of 5720 was weak and Nifty Future fell sharply below the 5720 level but the Nifty Spot level of 5700 provided good support. Nifty Future with a 2 leg pullback attempted to break the Nifty Spot 5700 level. When this attempt failed there was a third push up that resulted in a breakout failure of the trading range low (i.e. Nifty Spot 5720). This break out failure lead to the break of the 5700 Nifty Spot level
I have posted my observations on the significant candlestick bars.
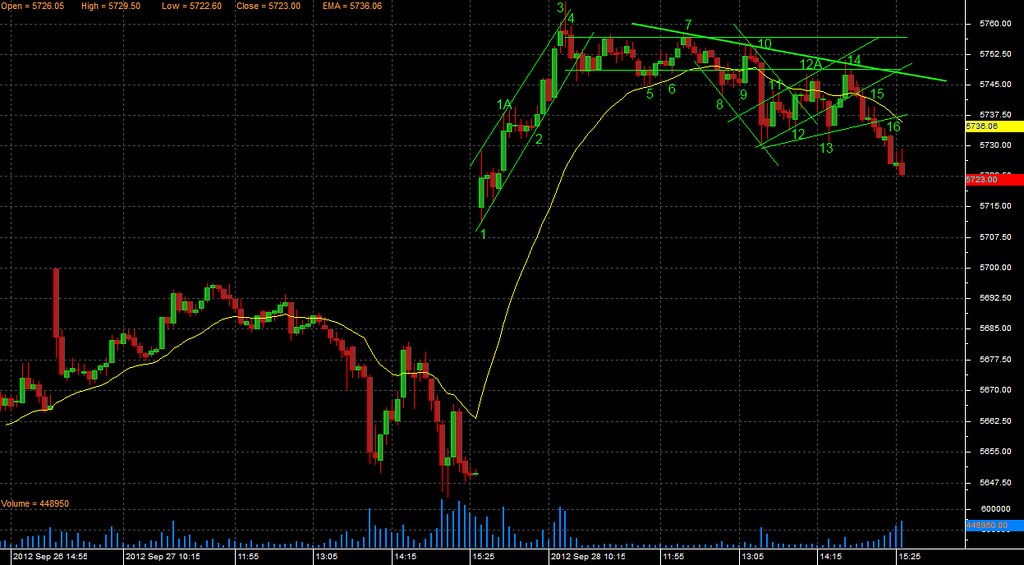
Bar 1: Price opened with a gap up which can be considered as a spike. This bar was a bull trend bar with tails on both side and an can be considered as a trading range.
Bar 1A: This is a strong Bull trend Bar that breaks out of the Nifty Spot 5700 level. The high of the bar enables drawing the trend channel line and parallel to the trend channel line would be the trend line drawn from Bar 1 low.
Bars between Bar 1A and Bar 2: These bars form a barbwire and a small tight trading range which can be interpreted as a small pullback which is a sign of strength or final flag that is a start of a reversal. But there is low possibility of reversal without a break out failure. Add long trade at the touch of the trend line as there is a higher probability of a spike and channel trend with 3 push up and the long entry would be at the start of the second push up.
Bar 2: This bar signals the move away from the trend line and confirmation of staying in the long trade.
Bar 3: This is a trend channel line overshoot and a single bar reversal. Close the long trade at the market.
Bar 4: This is a strong bear trend reversal bar and can be termed as the first breakout failure. The second strong breakout failure would be a good short trade entry. The first breakout failure when there is a steep bullish slope is to be ignored.
Bar 5: A very weak breakout failure of the down side. Price is forming a bull flag and this is the second leg in the wedge pattern.
Bar 6: This is a breakout from the wedge pattern but there is no strong trend generators such as a strong downside breakout failure. It is tough to take out strong levels without trend generators.
Bar 7: This is a small bear trend bar that changes the pattern from a wedge breakout into a tight trading range. This cannot be considered as a breakout failure of the prior swing high but as a failure to continue.
Bar 8: This is a strong bear trend bar and a clean breakout of the trading range. A breakout failure here could lead to a up move resumption.
Bars between Bar 8 and Bar 9: These are doji bars that signal very weak breakout. Also price remains below the tight trading range low after 3 bars ruling out breakout failure.
Bar 9: This is a strong bull trend bar after three bars and does not qualify as a downside breakout failure. Only a clean breakout of the trading range high would signal the resumption of the up move and justify a long trade.
Bar 10: This is a clean breakout of the tight trading range to the downside. A pullback close to the bottom of the trading range would be a good short trade.
Bar 11: Bear trend bar that is the 1 leg of the pullback of the down move.
Bar 12: This is a strong bull trend bar the swing low enables drawing the micro trend line from Bar 10 low. This bar breaks the downward micro trend line.
Bar 12A: This is a single bar reversal that slightly overshoots the micro trend channel line. Add short trade as this is the 2 leg of the pullback and close to the tight trading range low. The stop loss for this trade would be above the lower end of the trading range and at the downward trend line.
Bar 13: This is a strong Bear trend bar that breaks the micro upward trend line. Advance stop at the micro upward trend line. A strong down move should not test the micro trend line. The next bar is a strong bull trend reversal bar that touches the micro upward trend line and in the process blows the stop for the short trade.
Bar 14: This is the culmination of the third push up and ends in a breakout failure of the trading range low and a test of the downward trend line. The break of the micro upward trend line is a second attempt of trend line break and would be a stronger down move. Add short trade at the break of micro trend line.
Bar 15: This is a strong bear trend bar that breaks the second micro trend line and advance stop two ticks above this trend line.
Bar 16: This is a strong Bear trend bar that is a clean break out of the Bar 10 low. Exit short trade at the close of this bar
Hi Ramesh, im not a TA or a chartist.... but i can somewhat understand the comments... it would be nice if you could add a line or two as what to expect the following day
ReplyDeleteI have no idea how the next day price action will unfold. Over night events could completely change the game. Let us take for example the coming Monday and look at probable scenario's
ReplyDeleteScenario 1: Price opens at Nifty Spot level of 5680 and as a continuation of the previous day closing, the down move continues. The always-in trade would be short as it would be a continuation of the down move till the Nifty Spot 5648 level.
Scenario 2: Prices opens above the Nifty Spot level of 5740 and the first bar is a strong bull trend bar. The always-in trade would be a long as now bears are trapped.
Scenario 3: Price opens between the Nifty Spot level of 5700 and 5720 and the first few bars are doji. Then it best not to trade till the price action resolves itself.
Trying to figure out Monday's price action today is too much of a task. It is easier to allow the market to tell us of its intentions through subtle markers. I am in the process of creating a playbook with trade setups that tap opportunities that the market offers as the price action unfolds. These blogs are an exercise of back testing that help filter high probability setups with proper entry triggers and placement of stops.
I am conducting a post mortem of the price action using
1) 5 min candle bars
2) 21 EMA moving average
3) Important levels like
a) Previous Day High
b) Previous Day Low
c) Previous Day Close
d) Day's Open
e) Initial Range High and low i.e. Price Range in the first 30 to 60 mins
f) Important Nifty Spot levels based on Daily Chart trend line and trend channel line
4) Trend lines, Trend Channel lines, Micro trend line and Micro Channel lines
I am a follower of books written by Al Brooks and follow his trade ideas.
Al Brooks - Trading Price Action (Trends)
Al Brooks - Trading Price Action (Trading Ranges)
Al Brooks - Trading Price Action (Reversals)
Nice Blog, Good information about stock market, it is very informative
ReplyDeleteand helpful. I always ready to read this type of blogs.
Regards: nifty future price
It was a informatory post and it has a significant meaning , thanks for
ReplyDeletesharing the information. Would love to read your next post too…….
Nifty Future Price