Today was at best do not trade day as Nifty was locked in a severe Bear and Bull fight. It could have transitioned to a big move day had there been a clear winner. One indication of it being a trading range day was lackluster traded volume. But volume does tend to pick up when either the Bulls or Bears lose and the stop losses gets triggered. As trader we have to enter position at high probability trades and wait for the market to play out.
Given below are my observations of the important candlestick bars and their interpretations.
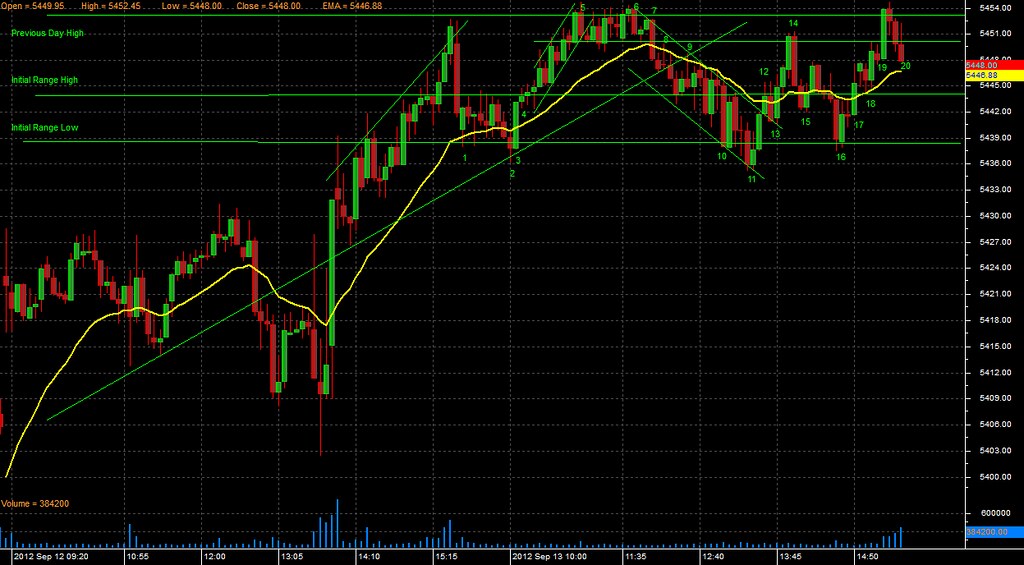
Bar 1: After yesterdays bullish closing session with the trend channel overshoot. This bar was the first test of the 21EMA.
Bars between Bar 1 and Bar 2: Defines the Initial Range with attempt to close below 21EMA finally accomplished
Bar 2: The first gap bar below the 21EMA The bar prior to this broke out below the 21 EMA.
Bar 3: Strong Bull trend Bar that breaks above the 21EMA and causes breakout failure of the prior bar and sets the Initial Range low
Bar 4: Small doji bar which tests the Initial Range high. This is an entry bar for long trade entry with stop loss below the Initial Range low. The breakout failure if it happens has to happen in the next few bars. Two bars after bar 4 the bar is small doji that closes above Initial Range High. After the third bar after Bar 4 closes decisively above the Initial Range High. Trail Stop loss to two ticks below the Initial Range High. Set target as the Previous Day High.
Bar 5: First Breakout failure of the Previous Day High. The long trade has been exited in the previous bar. This bar does not break the upward micro trend line channel. This is not a viable short trade as price is still above the longer term upward trend line and 21EMA. The next bar is a small doji signifying the down move may continue but two bars after Bar 5 is Bull trend Bar with a long tail at the top signaling lack of upward momentum.
Bars between Bar 5 and Bar 6: The momentum of the upward trend line is broken but instead of a pullback. Price makes a tight trading range 5249 and 5253. The Bear trend Bar cannot be counted as a reversal Bar as it is a part of overlapping bars in a trading range and there is nothing to reverse.
Bar 6: The prior bar to Bar 6 has close above the Previous Day high and the current Bar is a strong Bear reversal bar which closes at range low.
Bar 7: This is clear strong Bear trend bar which breaks out of both the 21EMA and the low of the trading range. This cannot be termed as the first pullback to the up move from 5340 to 5353 as this up move had transitioned to a tight trading range. The tight trading range had given a downside breakout.
Bar 8: The previous bar to this is a gap bar below the 21EMA which tests the upward trend line and fails and the current bar tests the 21EMA and fails. The first signal for adding a short trade.
Bar 9: Three bars prior to this Bar is a clear break of the upward trend line and the second bar prior to this bar is a test of the Initial Range High. The prior bar is a bull trend reversal from the Initial Range high. The current bar is a test of the upward trend line and the 21EMA. Both test end is down move resumption. Add short trade close to the downward sloping trend line with stop loss above the upward trend line and 1 tick above the trading range low i.e. 5449. Target for exit is the Initial Range low. This Bar behaved as a very strong bull trend bar that seemed certain to cross the upward trend line but at the last few seconds it collapsed back to close near the near the Initial Range High. Very important to allow the bar to complete and the next bar to be printed.
Bars between Bar 9 and Bar 10: Price keeps testing the 21EMA and prints big trend Bear and Bull Bar. This is an indication of Bulls are able to counter attack
Bar 10: The first test of the days low results in strong bull bar reversal to the Initial Range high. The next bar reverses this reversal. Exit from short trade at Initial Range low
Bar 11: The second break out failure of the days low and a double bottom. A break of the downward trend line could setup a strong up move
Bar 12: This bar breaks out and closes above the 21EMA, Initial Range high and the downward sloping trend line. A pullback to the downward trend line would be the first pullback and a long trade entry
Bar 13: Entry bar for adding long trade with stop loss below the Initial Range low and target the days high.
Bar 14: Very strong Bear Reversal Bar at the trading range low of 5449. Exit long at the market. This has become a scratch trade.
Bar 15: This Bar reverses the breakout below 21EMA but strong selling encountered above 21EMA rules out long entry on this breakout above 21EMA
Bar 16: Third test of the Initial Range low results in a strong Bull reversal bar
Bar 17: This Bar has a clean breakout of the 21EMA and touches the prior swing high. This is 2-leg pullback and a good long entry at the pullback to the 21EMA and the Initial Range high.
Bar 18: Entry Bar for adding long trade at the pullback to the 21EMA and Initial Range High.
Bar 19: Exit long position on the test of the Previous Day high
Bar 20: Breakout failure of the days high and pullback attempt to the 21EMA
No comments:
Post a Comment