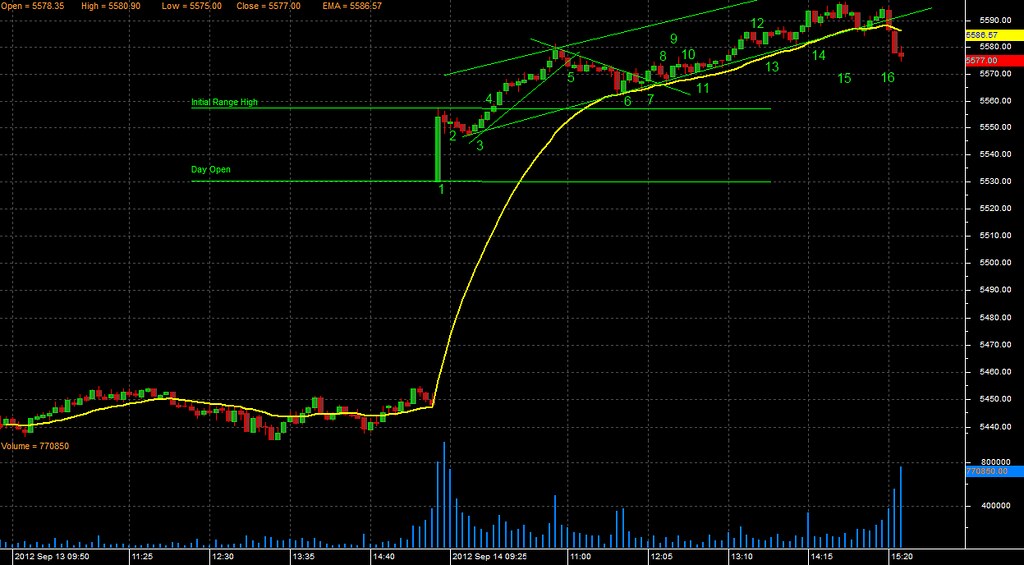
Nifty Future opened with huge gap up and proceeded to move up on high volumes. This was due to strong Global and Domestic cues. Inflation data was expected which may cause a dampener to the bullish sentiment. A day which opened in a strong note became sluggish due to high inflation data and closed at the level where it was prior to the announcement of the Inflation Data. I have given below the 5-min candlestick chart with my observations.
Given below are my observations of the important candlestick bars and their interpretations.
Bar 1: The first Bar of the day is a strong Bull trend Bar after a huge gap up. This would signify a measured move up equivalent to the gap up. Also this would act as a trading range. The full impact of overnight positive global and domestic cues have been absorbed in this bar.
Bar 2: Is the 1st leg of the weak and shallow pullback. Not advisable to add long here even if NF moves up from here can add long trade at the break of the 1st Bar high.
Bar 3: The 2nd leg of the shallow pullback. The 21 EMA is very far away. Add a long trade here but will have to maintain stop loss at the low of the first bar as there could be a possible 3rd leg down.
Bar 4: Weak Bull trend breakout of the Initial Range High. Strong trends do not give very good signals as traders do not like to buy at new highs but look to add trades in small increments thus fueling a strong but slow up move. Move stop loss four ticks below the breakout. Less aggressive traders with tighter stop loss can add a long trade here. Better location for long trade as it allows tighter stops. But today’s context was very bullish and not expecting Nifty to crack so early in the day.
Bar 5: After a strong up move the prior bar gave the first breakout failure bear trend signal bar and current bar gave a good bear trend entry bar. Close the long trade as micro trend line is broken. It will be foolish in a strong up move to add a short at the first breakout failure. The open and high of Bar 5 will act as a significant resistance. A breakout of this would be a signal to re enter the long trade.
Bars from Bar 5 to Bar 6: Price consolidates till the break of the inflation Data with a slight bearish bias.
Bar 6: A weak Bull trend reversal bar with a long tail at the top. This Bar reverses the strong bear trend breakout bar that stops at the 21EMA and 4 ticks above the Initial Range high. This swing low and the swing low of Bar 3 acts as a upward trend line of the day.
Bar 7: Two bars prior to current bar is a bear trend reversal bar that reverses the attempt to break the downward trend line but since it has overlapping prior bars there is nothing to reverse here. The first attempt to break the trend line generally fails. But this is a first signal of a likely second attempt after a test of the price extreme. The prior bar is a small doji bar that test the upward trend line, and the 21 EMA. The current bar is the second attempt strong Bull trend bar and it breaks the downward trend line. This is an addition of long trade with stop loss one tick below the Bar 6.
Bar 8: Strong Bear trend reversal bar that attempts to reverse Bar 7 breakout and the next bar test the upward trend line and 21EMA.
Bar 9: This strong Bull trend bar results in the failure of the failed breakout and is a strong continuation trade setup.
Bar 10: Weak reversal Bear trend doji bar but since there are overlapping prior bars this does not qualify as a reversal.
Bar 11: Bull trend Bar that resumes up move from the upward trend line. The next bars are small doji bar trading close to the upward trend line signifying consolidation.
Bar 12: Bear trend twin bar reversal. Move the stop closer by bringing it one tick above Bar 11
Bar 13: This Bar causes the failure of the bar 12 breakout failure. Can add to long trade at the low of current bar and the test of 21EMA or upward trend line.
Bar 14: Strong Bear trend Reversal Signal Bar but the entry bar is weak bull trend bar that is almost a inside bar. The down move lacks strength bring stop loss two ticks below the Bar 13 high.
Bar 15: Strong Bear trend reversal signal bar does not fully qualify as a twin bar reversal which is a stronger signal. But the next bar is weak doji entry bar. Two bars after this bar takes out the trailing stop loss and closes the long trade. This is a first signal of a possible reversal
Bar 16: The second strong breakout failure that acts as a double top and decisively breaks the upward trend line and the 21EMA. A pullback to test the 21EMA would have been a possible short trade entry but this does not materialize.
No comments:
Post a Comment