Nifty Future opened in a Bullish Note a continuation of the Previous days down ward trend line break. Nifty Future faced a strong reversal in the first hour of trade and moved below the Previous Day Low. The sentiment changed from mildly bullish to Bearish. Nifty Future settled in a tight trading range below the Previous day low. When a breakout to down side failed. Nifty Future resumed the morning session up move. Nifty Future faced resistance at the big round number 5700 and had a deep 3 push pullback that tested the Previous Day low.
I have posted my observations on the significant candlestick bars.
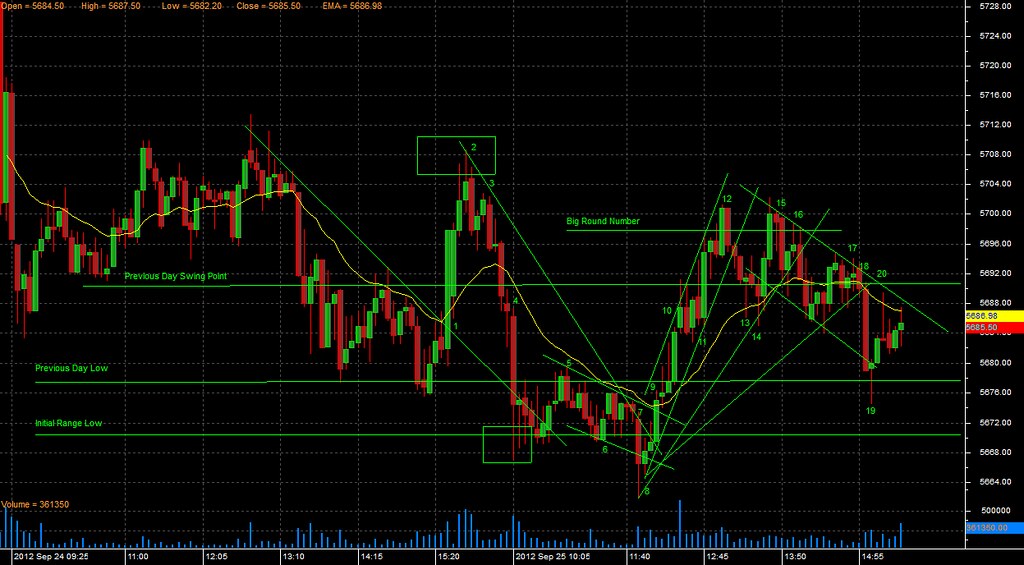
Bar 1: This bar was a continuation of the previous days downside breakout failure. Bar 1 opened below the Previous Day Swing Point and closed above it
Bar 2: The bars before Bar 2 had long tails at the top indicating selling pressure. Bar 2 was a strong Bear trend bar but cannot be termed as a Reversal Bar due to prior overlapping bar.
Bar 3: This bar is another strong bear trend bar and a failure of the up move resumption. Two bars after this bar is a clean break of the Previous Day Swing Point and 21EMA.
Bar 4: This bar is a climax bar which breaks the previous day low. This bar and the next few bars have long tails at the bottom signaling buying pressure below the previous day low.
Bar 5: This bar is a twin reversal bar of the Previous day low and resumption of the down move. Add short position at the pullback to the Previous day low and stop loss 1 tick above bar 5
Bar 6: This is the first BOF and a strong reversal bar with a strong entry bar but as price has not moved beyond the trend line. Keep short position open
Bar 7: At the attempt to break the downward trend line this bar is a strong bear trend breakout bar with long tail at the bottom signaling lack of follow through selling. Immediately bring stop loss below the Initial Range low as a strong down move will never come back to the breakout after a significant period of consolidation.
Bar 8: This is a weak reversal breakout failure signal bar for long trade and it blows the stop of the short position. The next bar is not able to close above the downward trend line and Initial Range Low. Add long trade with stop loss below this Bar
Bar 9: This Bar closes convincingly above downward trend line and the Previous day low. Trail stop loss below Initial Range Low
Bar 10: This Bar is a strong Bull trend Bar that closes above the Previous Day Low. Trail Stop loss below the Previous Day Low
Bar 11: The Bars prior to this Bar have long tail at the top indicating buildup in selling pressure. This Bar is a strong Bull trend Breakout bar of the Previous Day Swing Point. Trail Stop loss 2 ticks below the Previous Day Swing Point
Bar 12: This Bar is a strong twin bar reversal of the attempt to cross the Big Round Number 5700. Close the long position at market
Bar 13: First breakout failure of the 21EMA and close above the Previous Day Swing point.
Bar 14: The second breakout failure of the 21EMA and close below the Previous Day Swing Point but above the 21EMA. Add long position just below the 21EMA with target the breakout attempt of the prior high
Bar 15: This is a strong Bear trend three bar reversal bar that reverses the move back to the Previous Day Swing Point. Exit long at market.
Bar 16: This is the second test of the downward trend line and add short entry for a Double top failure with stop loss 2 ticks above Bar 15.
Bar 17: This bar is a breakout failure of the downward trend line but closes above the 21EMA. The 21EMA has flattened and price have been moving up and down with a higher frequency thereby making it irrelevant as an indicator.
Bar 18: This bar is a strong Bear trend bar that is a selling climax and an overshoot of the Trend Channel line. First trigger for possible reversal. Exit short position at the next bar
Bar 19: This is a breakout failure of the Previous Day Low and Trend Channel line. This would have been a signal bar but at 3:00pm insufficient time for a move to develop.
Bar 20: This bar is the first failure of the attempt to close above the 21EMA. But can be ignored as there are no open positions.
No comments:
Post a Comment