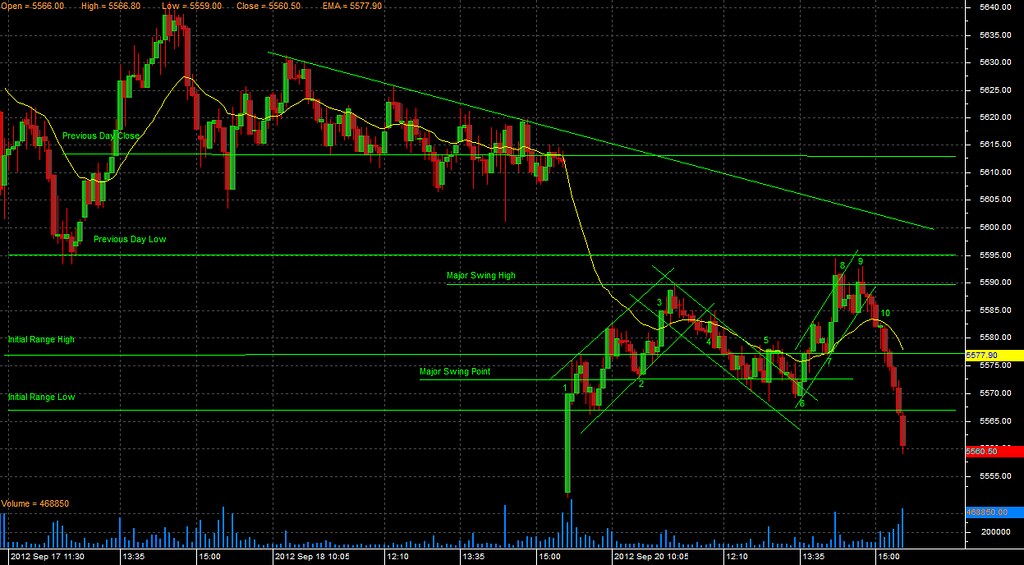
Nifty opened gap down below the Previous Day Low and the first bar was a strong Bull trend bar with a shaved head. There was follow through buying that took Nifty Future till a high of 5578. Nifty Future pulled back to 5568 and established a swing low and started to move up in a spike and trend channel. Nifty Future reversed at 5390 just short of the Previous Day Low. Nifty Future broke the upward trend line and reversed in tight downward sloping channel. Nifty Future transitioned into a trading range at the support from where the 3rd leg push started. At this major swing point Nifty Future had two breakout failures that lead to a second attempt at the Previous Day low. Nifty Future had two breakout failures at the Major Swing High that resulted in a sharp down move that started at 2:40pm till the close. The down move was very strong and did not give any meaningful pullback.
I have posted my observations on the significant candlestick bars
Bar 1: A very strong Bull trend Bar at the open that reverses the Nifty Spot level of 5550. A pullback of price to the corresponding Nifty Spot level is a long trade
Bar 2: 3 bar reversal from the prior high @ 5578. First bar is a strong bear trend bar, Second is a doji bar, Third bar is a strong bull trend bar that closes above the prior high. The third bar is a swing low that enables the drawing of the upward trend line. This trend line is the First Sign of Spike and Channel trend. Add long trade at the pullback to the initial range high and stop loss below the upward trend line.
Bar 3: A strong Bull trend bar that breaks out above the 21EMA. Trail stop loss just below the 21EMA. Exit long trade at the next strong bull trend bar as the Previous Day low is close.
Bar 4: A bull trend bar that is a first bar with a bull body after 10 small bear trend bar. It closes at the 21EMA. But the next bar is a strong bear trend reversal bar that reverses the attempt to breakout from the 21EMA. This Bar makes the swing high which along with the bar at the days high forms the downward trend line.
Bar 5: A strong Bull trend reversal signal bar that breaks and closes above the downward trend line. This bar is a breakout failure of the trading range low of major swing point. The entry bar for this bar fails to break and close above the 21EMA.
Bars between Bar 5 and Bar 6: These bars follow the down ward trend line and fail to close convincingly below it
Bar 6: This is a breakout failure of the trading range low @ 5572 and downward trend line. This signal bar is a weak bull trend bar. But the entry Bar for is a strong Bar that breaks out above the 21EMA. After the entry bar is a doji bar with close at the top signifying a failed attempt to close and reverse price below the Initial Range High and the 21EMA.
Bar 7: After printing 4 gap bars above the 21EMA. Price moves back to test the 21EMA and Initial Range high. Add long position at the Initial Range high with stop loss at the major swing point and target would be the breakout attempt of the Major Swing High. This Bar provides the swing low for the upward trend line. Exit long at the attempt to break out of Days high.
Bar 8: The prior bar is a very strong Bull trend bar that closes above the major swing high but is not able to cross the Previous Day low. The current bar is a strong reversal signal bar. This is the first signal of a short trade. Price could transition into a trading range or could form new lows. But to add short trade the trend line break is a necessary condition.
Bar 9: Price takes support at the upward trend line and makes a second attempt at the previous day low. The current bar is a strong bear trend reversal signal bar. This is a second break out failure and would be a stronger attempt at a reversal. The entry bar fails to break the upward trend line.
Bar 10: Prior bar is a strong Bear trend breakout signal bar that breaks down and closes below the 21EMA. The current bar is a weak doji bar that is a failure of a reversal attempt to close above the 21EMA. Add short trade with stop loss above the 21EMA. As the time is 2:40pm trail the stop loss to close at the days close.
No comments:
Post a Comment