Despite weak global cues and the previous days down move towards the closing of trading session. Nifty Future opened above the Previous Days Close and started to move in a very slightly sloping tight upward channel. The first attempt of Bears to break the upward channel resulted in a breakout failure and price moved to a more steeper and wider upward channel. The bullish trend was weak but bears were not present most of time. Maybe as tomorrow is a holiday the price action was subdued.
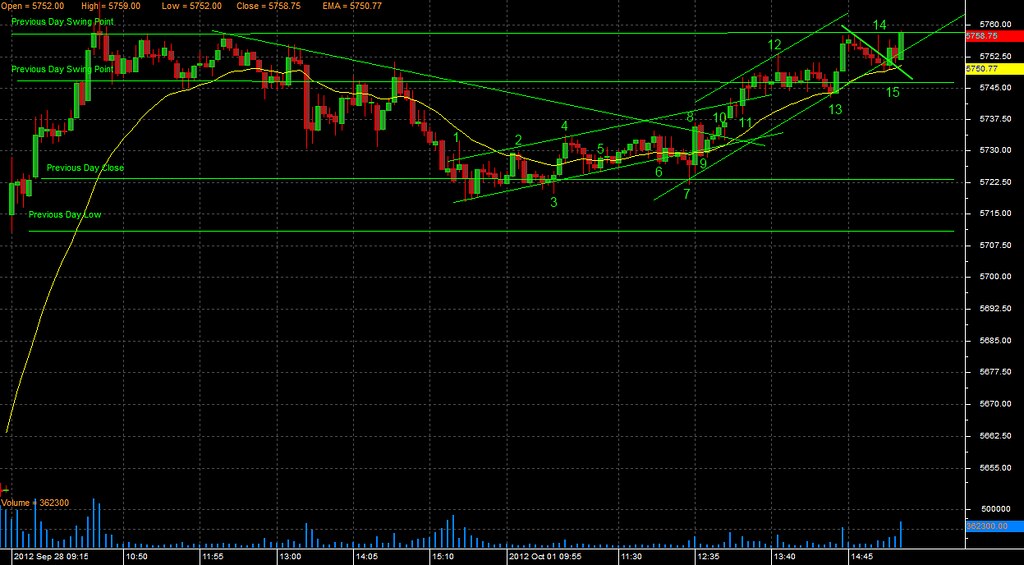
Bar 1: This bar opens close to the previous days close and attempts a up move that fails and acts as a single bar reversal of the move above Previous Day Close. The next two bars break the Previous Days Close. But after the close of these bars, price forms a congestion around the Previous Day close.
Bar 2: This strong Bull trend bar attempts to close above the 21EMA but prints a three bar reversal that brings price back to the Previous Day Close.
Bar 3: Single bar reversal of the Previous Day Close. It provides the swing low for drawing the upward trend line.
Bar 4: This bar makes a clean breakout from the 21EMA, Previous Day close. As subsequent bars are gap bars above the 21EMA it signals the transition of the down move to a trading range.
Bar 5: Bull trend Bar that reversed the close below the 21EMA and takes support of the upward trend line. Price stays close to the upward trend line and 21EMA.
Bar 6: Strong Bear trend bar that reverses the close of the prior 8 bars and closes below the 21EMA and at the trend line. The next bar reverses the close below 21EMA. This bar attempts to reverse the up move without testing the downward trend line and without a upside breakout failure. Also it does not have a strong follow through bar.
Bar 7: This is a single bar breakout failure of the Previous Day Close and a gap bar below the upward trend line.
Bar 8: This is a strong Bull trend bar after breakout failure of the Previous Days close. This Bar closes above the upward trend line, and 21EMA. It breaks and closes above the downward trend line. This bar reverses the close of the previous 15 bars. Also the first strong follow through bar of any breakout failure.
Bar 9: This is a Bear trend bar that reverses the close above downward trend line, upward trend line and 21EMA. But the subsequent bar closes above the 21EMA and the upward trend line.
Bar 10: This is the second attempt of the break of the downward trend line. This is likely to be a stronger breakout attempt. Add long position with stop loss below the upward trend line. This bar signals the failure of attempt to reverse the upside breakout of the downward trend line. The next bar initially moves higher confirming a strong entry bar to this breakout but it tests the downward trend line and sharply moves back to the high. The test of the downward trend line should have been the place to add long position. But the time window is very small and a limit order may fail to get filled. This test of the downward trend line is to run stops that after a breakout move stops closer. Traders who have been stopped out will be forced to add positions at higher prices.
Bar 11: Two bars prior to this bar is a failed breakout attempt of the Trend Channel line. One bar prior is a doji that closes at the trend channel line. The current bar has a clean breakout above the trend channel line and tests the Previous Day Swing Point. The subsequent bar attempts to close below the trend channel line but fails. Price forms a congestion around the Previous Day Swing Point. This bar could be also be a called a trend channel overshoot but price could transition from a less steep upward channel to a more steeper upward channel. Also subsequent bars fail to move back into the prior upward channel.
Bar 12: This is a single bar breakout failure that forms the swing high and allows the drawing of the trend channel line. The parallel line to this trend channel line drawn from the bar 7 low would be the new upward trend line. This is the first breakout failure of the steep up move and the next strong breakout failure could reverse the up move. Price forms a congestion around the Previous Day Swing Point.
Bar 13: Three bars prior to this bar is a weak breakout failure that starts a down move that breaks the tight trading range @ (5745 to 5750). The prior bar moves 1 tick below the 21EMA and closes at the 21EMA. The current bar is a strong reversal bar that reverses the downside breakout of the tight trading range. This bar tests the 21EMA and moves away from it. The current bar also provides the swing low for the new steeper upward trend line. Exit long position close to the Previous Day high.
Bar 14: This bar breaks the micro downward trend line without testing the upward trend line. This bar finally closes at the upward trend line. and is a failed breakout of the micro trend line. The next bar is a small doji bar that breaks the upward trend line and takes support at the 21EMA.
Bar 15: This is the second break of the micro trend line and moves back above the upward trend line. The next bar that attempts to reverse this move would be a scalp trade. But as it is closing of the trading session the risk to reward ratio is not favorable.
No comments:
Post a Comment