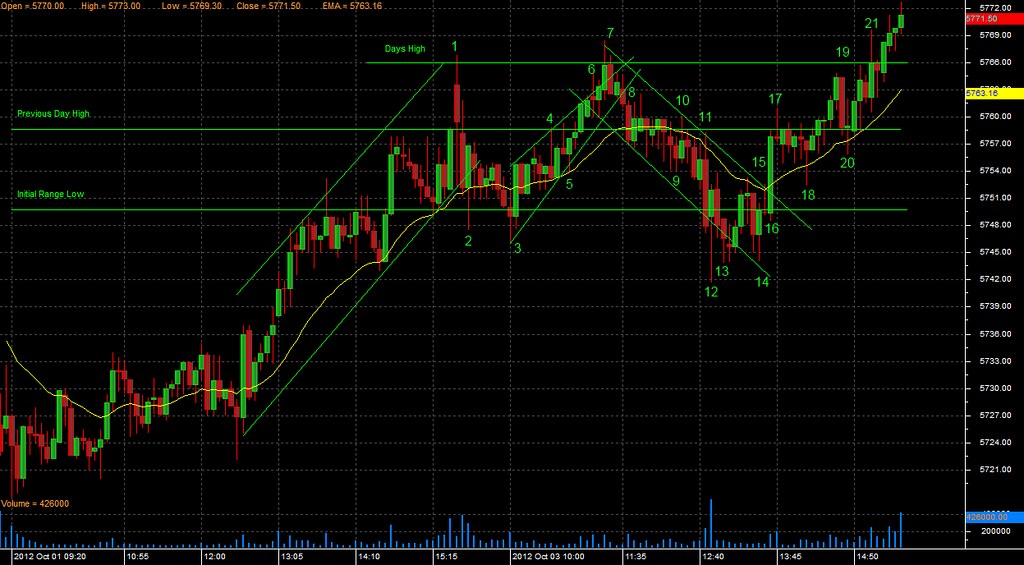
Nifty Future opened gap up on supportive global cues. But on open price tested the Previous Day high with a sharp fall. Nifty Future recovered and started an up move in a rising wedge pattern which reversed the up move at the days high. Nifty Future fall met with congestion at crucial levels. This was a sign of building buying pressure. Although Nifty Future made a lower low it recovered and started a stronger second attempt that took Nifty Future to new highs.
I have posted my observations on the significant candlestick bars.
Bar 1: The first bar of the day was a large bear trend bar. If this bar is to be considered as a continuation of Previous Day Price Action then it could be stated that it was a breakout failure of the Previous Day High but closed just above the Previous Day High. The next bar was a Bear trend bar that closed at the Bar 1 low.
Bar 2: This was a strong breakout failure of the Previous Day Range High. As this is the first breakout failure it is most likely a with trend trade and as the pullback was deep. The high of bar 2 is a addition of the short trade with stop loss above the Previous Day High and the target is the Initial Range low
Bar 3: Exit the short trade at the previous bar as it has touched the target. This bar is a strong second attempt breakout failure of the Initial Range low and closes above the 21EMA after printing a gap bar below. As it is the second breakout failure it is likely to lead a move above the Previous Day high. Add long at the pullback to the 21EMA.
Bar 4: This is the first breakout failure of the Previous Day high in the current up move. The bar takes support at the 21EMA.
Bar 5: Takes support at the 21EMA and resumes attempt of the Previous Day high. Price is moving in a rising wedge which is bearish. Trail stop loss close to Previous Day High on breakout of the Previous Day high.
Bar 6: Two bars prior to this bar is a clean breakout from the Previous Day High. The current bar is a the first trend channel line overshoot and a sign of topping of the rising wedge.
Bar 7: This is a strong bear trend twin reversal bar that is a breakout failure of the Days high. This is bar is also a Trend Channel overshoot and a double top. Close long position at the market and reverse and add short trade at the next bar with stop loss above current bar.
Bar 8: This is a strong Bear trend bar that breaks out below the Previous Day high. The subsequent bar form a congestion around Previous Day high. Price moves in a downward channel. Cannot bring stops closer as there is no clean breakout of the 21EMA and the Previous Day high.
Bar 9: This is a clean breakout of the 21EMA and a gap bar below 21EMA. Trail Stop loss at Bar 8 high as the price tends to be drawn to a price congestion. Bringing stops closer could blow the short trade prematurely and will be effectively trapped out of a good trade entry.
Bar 10: This is a failed breakout of the 21EMA and the Previous Day High. This bar would have blown stops that would have trailed very closely. Trail stop loss just above Bar 10.
Bar 11: This is a large Bear trend bar almost a climax bar. But as the down move has been for limited duration cannot be a climax bar. This Bar breaks the Initial Range low. Trail stop loss and bring it two ticks above the Initial Range low. This bar was a trend channel overshoot and if it is the start of a steeper sloping downward channel then price will not come back to the Initial Range low.
Bar 12: This is a strong bull trend reversal bar that is a breakout failure of the Initial Range low. Since this is the first breakout failure of the current down move. This bar blows the stop loss and since the breakout failure is very strong do not add short trade above the bar 12 high. Do not add long trade till there is second breakout failure of the Initial Range high, as the down move slope is steep.
Bar 13: This bar is another trend channel line over shoot but price moves back into the downward channel signaling low downward momentum.
Bar 14: This is the second breakout failure of the Initial Range low and add a long entry with stop loss below the Bar 14 low.
Bar 15: This bar is a breakout failure of the 21EMA and the downward trend line. As it is the first attempt this is acceptable. If there is a second attempt strong breakout failure then exit position.
Bar 16: This is a very strong Bull trend breakout bar that breaks clean from the 21EMA and the downward trend line. Immediately trail stop loss 1 tick above the Initial Range low. As this is the second attempt at up move it is likely that the days high would be taken out.
Bar 17: This is the first breakout failure of the Previous day high and can be tolerated. Hold long position but brace up for deep pullback.
Bar 18: This is a breakout failure of the 21EMA and add another lot for short position and trail stop loss just below the bar 18
Bar 19: This is a strong bear trend reversal bar just before the Days high. This brings price back to the Previous day high where there was a clean breakout. Hold long position till days high is taken out.
Bar 20: This is a single bar breakout failure of the 21EMA and the Previous Day high. Trail stop loss below Bar 20.
Bar 21: This bar lead to the break of the Days high and close long position above the days high as it is session closing time and a sharp reversal could blow away all the profits.
Very good post sir.
ReplyDeleteI am also reading Al Brooks and a big fan of his please keep posting, the post of yours is truly a knowledge wealth.
Thanks, Some of the trade entries are based on hindsight. I stopped posting as there was one important part that i feel has not been covered by Al Brooks. That is after the first 30 minutes of trade. There is usually either the Bulls or the Bears that are actively bidding up/down the prices. The price action when price approaches prior support/resistance levels is the key for good trade entries.
ReplyDeleteHi Sir,
ReplyDeleteI like his money mangement style which keeeps you protected everytime and is a biggest plus point, i havent read so extensive money mangement tricks by anyone. I have his videos and they are quite good. Sir do let me know how much time it took you to to reach to the level of reading each bar. Is there any way i can get in touch with you to clear any queries or doubts if I have any and only if you wish to reslove them, please do let me know, my email id is merchantparvez@gmail.com
Regards,
Merchant