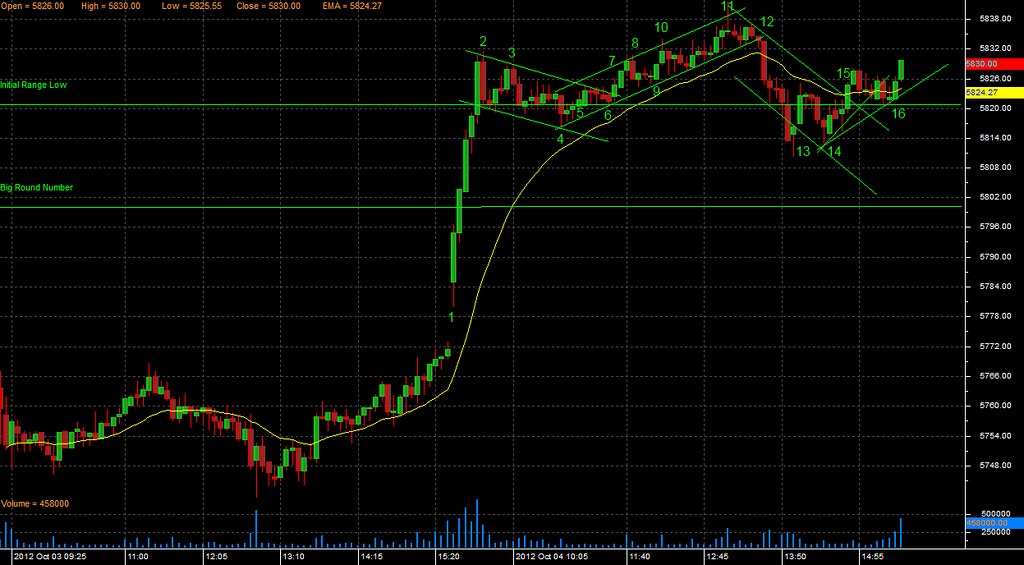
Backed by strong domestic cues Nifty Future opened gap up and moved in a strong up move that broke the Nifty Future level of 5800 and paused at Nifty Spot level of 4800. The morning session spike transformed into a Bull Flag which after 3 push down started to move up in a channel trend. Price made a spike – 3 push Bull Flag – channel trend. Price was in a tight upward channel for 20 points. A trend channel overshoot and a strong single bar bear trend reversal resulted in a pullback that broke below the Initial Range low. This resulted in a breakout failure and Nifty Future crawled back above the Initial Range low.
I have posted my observations on the significant candlestick bars.
Bar 1: After a gap up this bar was a strong Bull trend bar with strong volumes which closed below the Big Round Number @ 4800. The next bar took out the 4800 level decisively. This is a long trade in a spike to be closed at the first sign of reversal and re test of the price extreme. The stop loss would be below Bar 1.
Bar 2: This is the first strong reversal bear trend bar and defines a resistance level. The 1 leg of the pullback forms the Initial Range low.
Bar 3: This is a strong bear trend reversal bar that forms the 2 leg of the pullback. Price forms a congestion at the Initial Range low.
Bar 4: This is the third push down of the bull flag and a clean breakout of the Initial Range low. Up move resumption can be expected after a 3 push pullback.
Bar 5: This is the first breakout back into the Initial Range low but the downside breakout failure required three bars to fail the breakout of the Initial Range low. This is a sign of weakness in buying pressure.
Bar 6: This is the trend line touch of the tight upward sloping channel. Add long trade with stop loss below the bar 4 low
Bar 7: This is a clean breakout of the downward trend line of the Bull Flag and a possible up move resumption.
Bar 8: This is a breakout failure bear trend reversal signal bar but the entry bar and the subsequent bar lack follow through and form doji bars.
Bar 9: This bar resumes the up move with the support of the upward trend line and causes the failure of the breakout failure.
Bar 10: This bar has a small trend channel line overshoot that tests the days high. The subsequent bars act as trading range and stay in the upward tight trading channel.
Bar 11: This is a trend channel overshoot and a strong single bar breakout failure. Close long position at the next sign of strength.
Bar 12: This is a clean breakout of the tight upward channel and the 21EMA. Price does not pullback to the 21EMA but breaks the Initial Range low in the first leg of the pullback.
Bar 13: This is the first breakout failure of the down move with a strong Trend Channel line overshoot. The second breakout failure would be a addition of long position. This bar breaks cleanly above the Initial Range Low but falls short of the 21EMA. Close to the 21EMA is a possible short trade but as the breakout failure was strong. This trade is not feasible.
Bar 14: This bar is a weak breakout failure that closes below the Initial Range low. The pullback to the Bar 14 low is a long trade with stop loss below Bar 13 the low of the day.
Bar 15: This is a clean breakout of the Initial Range low and the 21EMA. Trail stop loss 2 ticks below the 21EMA. A strong up move should pull away from the 21EMA. But as the up move is weak the stop gets blown.
No comments:
Post a Comment