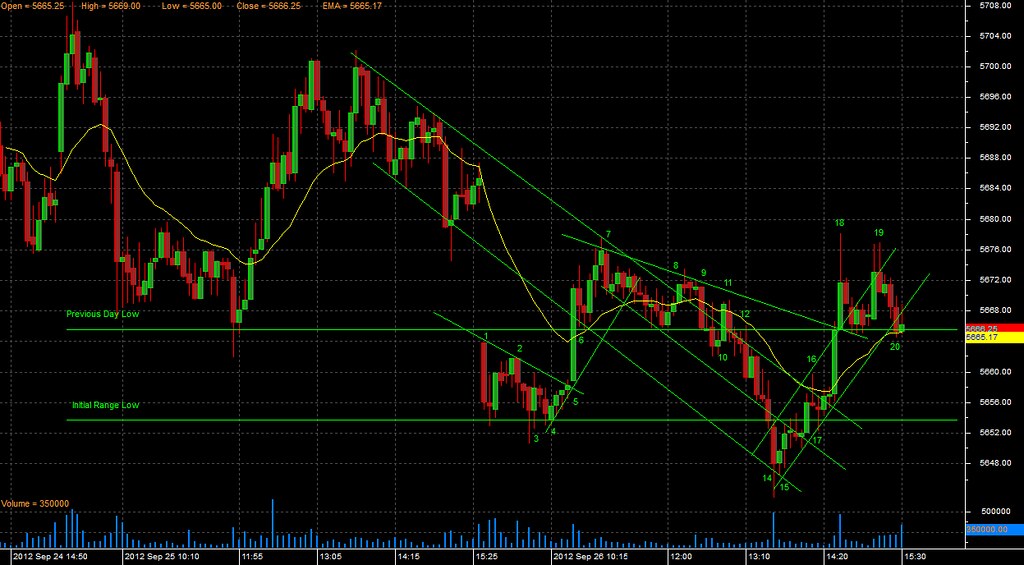
Reflecting Weak Global cues Nifty Future opened gap down and the first bar was a big bear trend bar that acted as a trading range. This down move could be considered as a continuation of the previous day downward channel and the gap down open as a trend channel overshoot. Price moved back into the downward channel and drifted down to a new low. The break of the Initial Range low and the Trend channel line overshoot lead to a reversal that went all the way till the days high. Here selling pressure resulted in a double top and a closing near the days opening price
I have posted my observations on the significant candlestick bars.
Bar 1: Nifty has a gap down opening and the first bar is a large bear trend bar. Two bars after the current bar is a reversal bar that lacks follow through. This bar along with the gap down open can be considered as a Trend Channel line overshoot. Can expect price to move back into the channel or if down move is strong then a spike and channel trend could follow.
Bar 2: This bar is bear trend bar that resumes the down move but has a long tail at the bottom signaling buying pressure. Also forms the swing high for drawing the micro trend line.
Bar 3: This bar is a strong Bull trend reversal twin bar that is the first breakout failure of the days low.
Bar 4: This is a weak bull trend reversal bar that is the second breakout failure of the days low. A break of the micro trend line is a long trade entry
Bar 5: This is an entry bar for the long trade entry and is a very strong Bull trend Bar that closes above the 21EMA and the Previous Day low decisively and brings price back in the downward sloping channel.
Bar 6: This bar test the 21EMA and the Previous Day low. Add long trade close to the Previous day low with stop loss 2 tick below the Previous Day Low.
Bar 7: This is a strong reversal bear trend bar and the prior bar high was touching the downward trend line. After this reversal price follows the downward channel in a range bound manner. Exit long position at the market.
Bar 8: With price printing a gap bar below the 21EMA there will be a test of the price extreme which will determine the up move continuation. This bar moves above the 21EMA and the downward trend line.
Bar 9: This is a strong bear trend bar that reverses the 21EMA and downward trend line breakout. This bar tests the Previous day low and closes at it.
Bar 10: This is a strong bull trend bar that breaks out above the 21EMA and the downward trend line. A break out above the micro trend line will be a long trade entry. But the next entry bar does not move even 1 tick above the current bar.
Bar 11: This is a strong bear trend bar that reverses the break out of the downward trend line and the 21EMA. This is the second breakout failure and add short trade entry with stop loss above the micro trend line drawn from bar 7 to bar 8.
Bar 12: This is a strong Bear trend bar that is a failure of the attempt to break out above the Previous Day Low and the Downward trend line. Move the stop loss 1 tick below the Previous Day Low.
Bar 14: This is a strong and climactic bear trend bar that overshoots the Trend Channel. Exit the short trade at the market.
Bar 15: This is a strong bull trend bar but does not reverse above the Initial Range low. The next few bars have long tails at the top indicating selling pressure at the Initial Range low. The break out above the Initial Range low would be the first trigger for the long trade.
Bar 16: This is the first break out failure of the 21EMA and the downward trend line. The second attempt would be a stronger attempt.
Bar 17: This bar is a breakout failure of the Initial Range low. This Bar forms the swing low for upward trend line and draw a parallel line from the top of the bar 16 for the trend channel line. Add long trade at the touch of the upward trend line with stop loss 1 tick below the Initial Range low.
Bar 18: This bar is a strong bull trend bar that developed weakness on the test of the days high. Close the long trade at market at the test of the days high.
Bar 19: This is the second breakout failure and a strong bear trend bar that reverses the second overshoot of the Trend Channel line and a double top. This is a very good short trade entry but this is too late for the down move to unfold.
Bar 20: This is a strong bear trend bar that breaks out of the upward trend line. But the next bar lacks follow through and is the last bar of the day.
No comments:
Post a Comment